

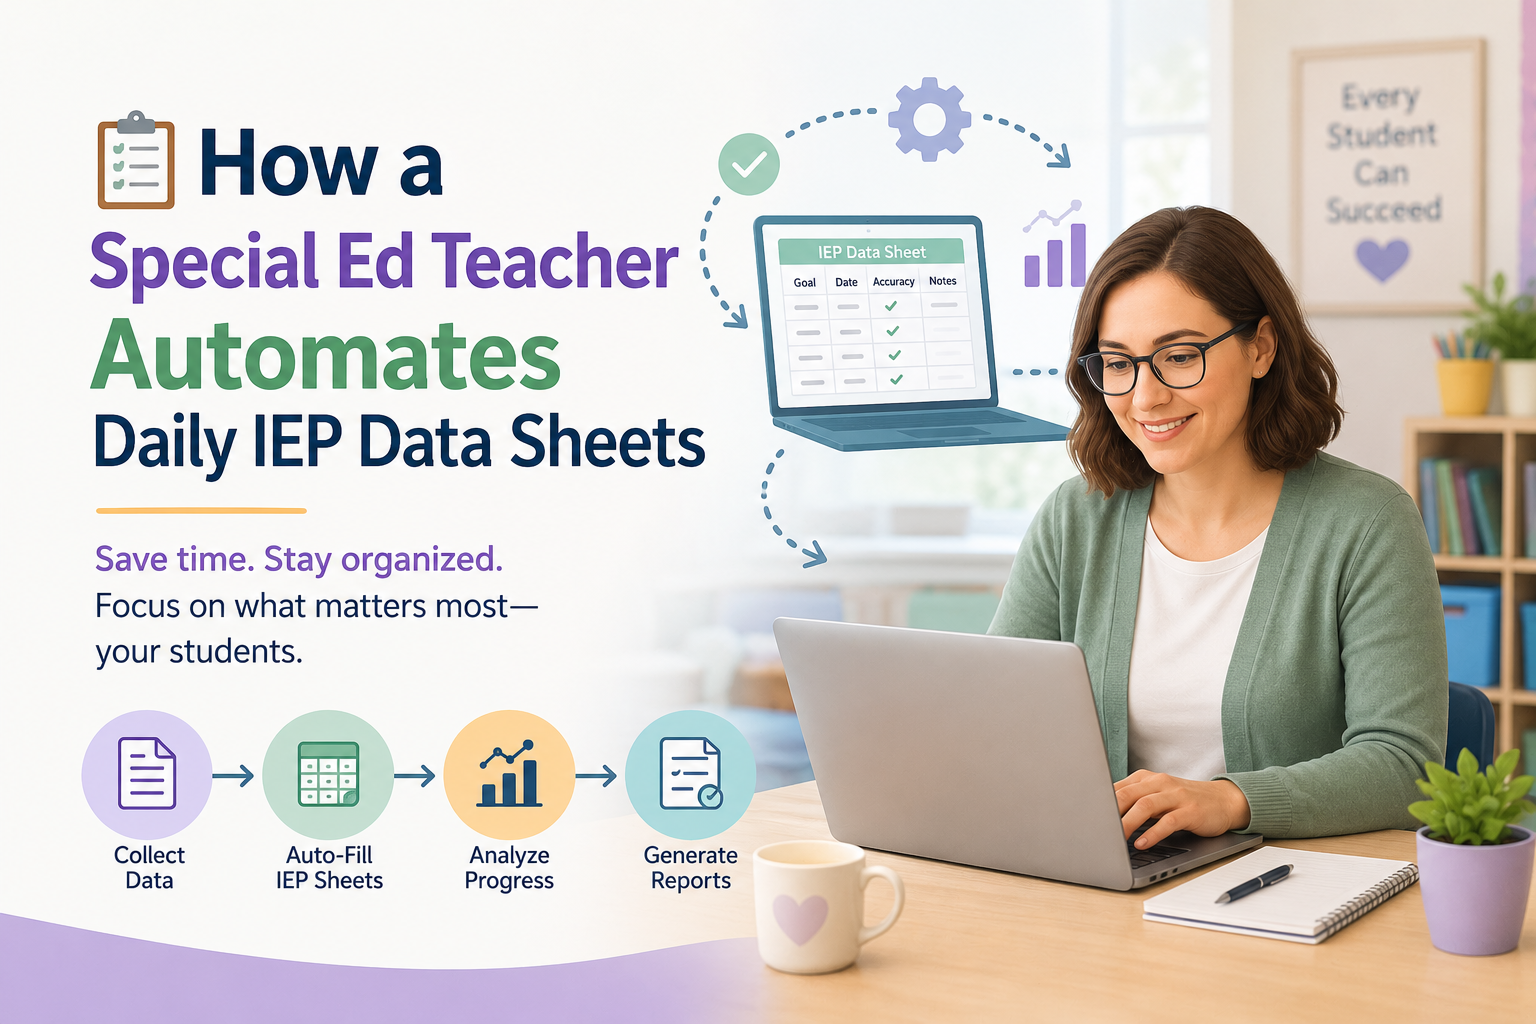
📋 How a Special Ed Teacher Automates Daily IEP Data Sheets: 2026 Free Google Forms + QR Code System
Every Special Ed Teacher knows the reality: you are mid-transition, three students need attention simultaneously, and your paper data sheet is buried under someone’s lunch box. The solution is a semi-automated digital data system using free Google Forms linked to QR codes — set it up once, scan in seconds during any transition, and watch your data collect itself into a live Google Sheets dashboard.
This guide shows you exactly how. 💛

- 😤 The Real Problem: Why Paper IEP Data Sheets Are Failing Special Ed Teachers
- 📊 The Numbers: Paperwork Burden, AI Adoption, and the Case for Automation
- ⚙️ What This System Does and How It Works
- 🛒 What You Need (Everything Free)
- ✅ THE 10-STEP SETUP: FROM ZERO TO SCANNING IN ONE PLANNING PERIOD
- 📝 Step 1: Open Google Forms and Create a New Form
- 📋 Step 2: Set Up Your Core Form Fields
- 🔗 Step 3: Get the Form Link
- 📱 Step 4: Generate Your QR Code
- 🎨 Step 5: Design Your QR Code Cards in Canva (Optional but Recommended)
- 🖨️ Step 6: Print, Laminate, and Deploy
- 📊 Step 7: Open and Organise Your Google Sheets Dashboard
- 📈 Step 8: Build a Basic Progress Chart for Each Student
- 🤖 Step 9: Add Conditional Formatting for At-a-Glance Alerts
- 📧 Step 10: Set Up Automatic Email Digests (Optional — Advanced)
- 🔍 What You Must Not Miss About This Topic
- 1. ⏱️ The Transition Moment Is the Critical Design Constraint
- 2. 🤝 Paraprofessional Data Collection Is Almost Never Addressed
- 3. 📊 The “One Form Per Student vs. One Form for All Students” Debate
- 4. 🔐 FERPA and Privacy in Google Forms
- 5. 🌡️ Baseline Data Is the Missing First Step
- 💙 A Teacher’s Story: The Wednesday That Changed Everything
- ❓ FAQs About Automating IEP Data Sheets
- Q: What is the fastest way to collect IEP data during class transitions?
- Q: Is Google Forms FERPA compliant for student data?
- Q: How do I create a QR code for a Google Form?
- Q: Can paraprofessionals collect IEP data using this system?
- Q: How do I turn Google Sheets IEP data into a progress graph?
- Q: How many QR codes should a Special Ed Teacher create?
- Q: What is the difference between paper IEP data sheets and this digital system?
- 🔗 Trusted Resources for Special Ed Teachers
- 💙 Final Thoughts: Your Data Should Work as Hard as You Do
😤 The Real Problem: Why Paper IEP Data Sheets Are Failing Special Ed Teachers
Ask any Special Ed Teacher what the most time-consuming, frustrating, and least rewarding part of their job is. Almost universally, the answer is not the teaching. It is the documentation.
It is no surprise that special education teachers are faced with a lot of paperwork — and the latest statistics on exactly how much time it takes to manage all of it are genuinely alarming.
The U.S. Government Accountability Office has polled administrators and special educators from 37 states to identify administrative tasks under IDEA that each group found to be particularly burdensome — with data collection and documentation consistently appearing at the top. (Source: Frontline Education — IEP Resource Center)
Here is what happens in a typical classroom:
A Special Ed Teacher has five students with individual IEP goals. Each student has three to five active goals.
During a 45-minute reading group, they should be collecting trial data on each student’s progress toward those goals — recording accuracy percentages, prompting levels, and qualitative observations. Simultaneously, they are facilitating instruction, managing behaviour, supporting paraprofessionals, and monitoring the room.
Paper data sheets require the teacher to locate the correct sheet, find the correct row for today’s date, record the data in the right format, and not lose the sheet before the end of the day. During class transitions — the busiest, most chaotic moments of the school day — this is practically impossible.
The result is what most Special Ed Teachers call “parking lot data” — data that is recorded from memory at the end of the day, or after school, based on what the teacher can approximately reconstruct from the session. It is not accurate. It is not real-time. And it does not serve the child.
A Google Forms + QR code system changes this fundamentally.
📊 The Numbers: Paperwork Burden, AI Adoption, and the Case for Automation
| Statistic | Figure | Source |
|---|---|---|
| Special ed teachers using AI for IEPs (2024-25) | 57% — up from 39% in 2023-24 | EdWeek — AI and IEPs, Jan 2026 |
| AI used to identify trends in student progress data | 31% of special ed teachers | EdWeek — AI and IEPs, Jan 2026 |
| AI used to generate IEP plans in full | 15% of special ed teachers (up from 8%) | EdWeek, 2026 |
| US students with IEPs receiving services | 7.9 million (2023-24) | Congress.gov — IDEA Part B, Feb 2026 |
| Data collection methods: Inconsistency problem | Inconsistent collection across staff is a top challenge | IEPData.com — Datability Platform |
| IEP tracking software benefit documented | Real-time data, audit-ready documentation, reduced last-minute reporting stress | Brolly IEP Software — LevelData.com |
| Special education teacher shortage | Severe — districts recruiting outside US | Frontline Education Resource Center |
| Time spent on IEP paperwork vs. teaching | Paperwork burden identified as major burnout driver by GAO | Frontline Education — GAO Data |
💡 What this tells every Special Ed Teacher: You are not alone in being buried in documentation. And you are not wrong to think there is a better way. The trend toward automation and digital data systems is accelerating precisely because the evidence shows it works — for teachers’ time and for student outcomes.
⚙️ What This System Does and How It Works
Before building anything, here is the plain-language overview of the system.
The core workflow:
- You build a Google Form with fields matching your IEP data sheet (student name, goal, date, performance level, notes)
- You convert that link into a QR code — a scannable square image
- You print and laminate each QR code and attach it to the wall, a clipboard, a lanyard, or directly to the student’s work area
- During a class transition, you or a paraprofessional scans the QR code with a phone or tablet — the form opens instantly
- You enter the data in 20–30 seconds and submit
- All responses automatically flow into a Google Sheets spreadsheet — your live data dashboard
- Google Sheets auto-formats data into charts and progress graphs, ready for any IEP meeting
What you eliminate: Locating paper sheets, transcribing data after class, lost papers, illegible handwriting, and time-consuming manual graphing.
What you keep: Full control over what data you collect, when you collect it, and how it is presented — with zero subscription fees.
🛒 What You Need (Everything Free)
| Tool | Purpose | Cost |
|---|---|---|
| Google Forms | Build the digital data collection form | Free with any Google account |
| Google Sheets | Automatic data dashboard | Free — auto-linked to your Form |
| QR Code Generator (QRCode.com or goqr.me) | Convert form links to scannable codes | Free |
| Canva (optional) | Design attractive, laminated QR code cards | Free tier available |
| Laminator (school supply room) | Protect printed QR codes | Already in most schools |
| Smartphone or tablet | Scan QR codes during the school day | Already in your pocket |
| Google Sheets add-on: Awesome Table (optional) | Turn data into visual dashboards | Free tier available |
Total cost: $0 for the complete system.
✅ THE 10-STEP SETUP: FROM ZERO TO SCANNING IN ONE PLANNING PERIOD
Plan for 60–90 minutes for your first complete setup. Every subsequent student takes about 10 minutes to add.

📝 Step 1: Open Google Forms and Create a New Form
Go to forms.google.com and click the “+” button to create a new blank form. Name it something clear: “Ms. Johnson — IEP Data Collection 2025-26.”
📋 Step 2: Set Up Your Core Form Fields
Every IEP data form needs these fields. Add them as Google Form questions:
| Field | Question Type | Notes |
|---|---|---|
| Student Name | Dropdown | Pre-populate with your students’ names |
| Date | Date | Set to auto-populate today’s date if possible; or short-answer |
| IEP Goal | Dropdown | List each active goal — keep it brief (e.g., “Reading fluency — 80 WPM”) |
| Session Type | Dropdown | Options: Group instruction, 1:1 pull-out, Push-in support, Independent work |
| Performance Level | Multiple choice or dropdown | Options: Independent, Verbal prompt, Model prompt, Physical prompt, No response |
| Percentage / Trials Correct | Short answer or linear scale | Enter e.g. “7/10” or “70%” |
| Prompt Level | Multiple choice | Options: 0 (independent), 1 (verbal), 2 (model), 3 (physical), 4 (no response) |
| Observation Notes | Paragraph | Free text for qualitative notes |
| Who Collected Data? | Multiple choice | Teacher, Para A, Para B — prevents data attribution confusion |
Pro tip: Use Google Forms “Required” setting only on the most essential fields. Reducing friction during a transition is the entire point.
🔗 Step 3: Get the Form Link
Click the purple “Send” button in the upper right of the form. Select the link icon (chain link symbol). Copy the link. This is what becomes your QR code.
Optional but recommended: Click “Shorten URL” — this makes the QR code less dense and easier to scan quickly.
📱 Step 4: Generate Your QR Code
Go to goqr.me or qrcode.com — both are free. Paste your Google Form link into the URL field. Select “Static QR code” (free). Download the QR code image as a PNG file.
Size recommendation: Generate at 300×300 pixels minimum for reliable scanning. For wall mounting, 600×600 is ideal.
🎨 Step 5: Design Your QR Code Cards in Canva (Optional but Recommended)
A plain QR code on white paper is functional. A colour-coded, student-labelled card on a laminated sheet is significantly more durable and much faster to locate during a chaotic transition.
In Canva (canva.com — free):
- Create a new design at card size (3.5″ × 5″ or similar)
- Upload your QR code image
- Add the student’s name in large, clear text
- Add the goal abbreviation (e.g., “Reading Fluency”)
- Set a colour background consistent with your classroom organisation system (e.g., blue for reading goals, green for maths)
- Download as PDF for printing
🖨️ Step 6: Print, Laminate, and Deploy
Print your QR code cards. Laminate them. Then deploy them in locations that make scanning fast during transitions:
- On a clipboard ring — one card per student, carried by paraprofessionals
- On the student’s desk corner — scannable without moving anything
- On a wall station near the door — scan as the student exits the room
- On a lanyard worn by the teacher — for 1:1 data collection
- In a clear pocket on a binder — flat and visible without searching
Create separate QR codes for different goal areas if you have students with many goals, to keep each form short and fast.
📊 Step 7: Open and Organise Your Google Sheets Dashboard
When you created the Google Form, Google automatically created a linked spreadsheet. Access it by clicking “Responses” in your Form and then the green Sheets icon.
Your spreadsheet now has one row per form submission, with columns matching your form fields. This is your raw data.
Basic organisation steps:
- Rename Tab 1 “Raw Data”
- Create Tab 2 “Student Dashboard” — this is where you will build your progress views
- Use Google Sheets
FILTERformulas to pull each student’s data onto their own tab
📈 Step 8: Build a Basic Progress Chart for Each Student
In your Student Dashboard tab:
- Filter that student’s data using:
=FILTER('Raw Data'!A:I, 'Raw Data'!B:B="Student Name") - Select the date column and the percentage column for that student
- Insert → Chart → Line chart
- This automatically becomes a running progress graph — updated every time new data is submitted
This chart is now ready to present at any IEP meeting, progress review, or parent communication — with zero additional work.
🤖 Step 9: Add Conditional Formatting for At-a-Glance Alerts
In the Raw Data tab, add conditional formatting to the Percentage column:
- Red background: below 60% (concern)
- Yellow background: 60–79% (approaching)
- Green background: 80%+ (meeting goal)
Now when you open the spreadsheet at the end of the week, you see at a glance which students and which goals need attention. No manual review. No digging through paper notes.
📧 Step 10: Set Up Automatic Email Digests (Optional — Advanced)
In Google Sheets, use Tools → Script Editor to create a simple Apps Script that emails you a summary of the week’s data every Friday at 4pm. If this feels too technical, the free add-on Awesome Table or Form Publisher can generate PDF progress summaries automatically from your Google Sheets data with no coding required.
🔍 What You Must Not Miss About This Topic
1. ⏱️ The Transition Moment Is the Critical Design Constraint
Most digital data collection tutorials assume a teacher has a moment of relative calm to enter data. They are not designed for the reality of a Special Ed Teacher during a class transition — where 30–60 seconds is all that is available, three things are happening simultaneously, and any friction in the data entry process means the data simply does not get collected.
Every design decision in this guide — single-tap QR scanning, pre-populated dropdown fields, no required fields for non-essential data — is specifically optimised for that 30-second window. This design principle is almost never addressed in generic “digital data sheets” tutorials.
2. 🤝 Paraprofessional Data Collection Is Almost Never Addressed
Most data systems are designed to be used by the teacher. But in most Special Ed Teacher classrooms, paraprofessionals are present for significant portions of the day — and they are frequently in a better position to collect data than the teacher, who is often facilitating instruction simultaneously.
The QR code system in this guide is explicitly designed for paraprofessional use: a laminated card at a student’s desk means any staff member in the room can scan, complete the 30-second form, and contribute to the data set. No access to the teacher’s device required. No login needed. No training in a complex system.
3. 📊 The “One Form Per Student vs. One Form for All Students” Debate
This guide recommends one form for all students with a student name dropdown — because separate QR codes per student with separate linked sheets become exponentially complex to manage across a full caseload. A single form, filtered in Sheets, is far more manageable and produces the same data quality with significantly less maintenance overhead.
4. 🔐 FERPA and Privacy in Google Forms
No data collection guide for a Special Ed Teacher should skip privacy. Google Workspace for Education (which most districts provide) meets FERPA requirements under Google’s data processing terms for school districts. However, personal Google accounts (gmail.com) have different data terms. Always use your school-issued Google Workspace for Education account for any student data collection — never a personal account.
5. 🌡️ Baseline Data Is the Missing First Step
Almost every special ed data collection tutorial jumps straight to tracking without emphasising that the first data points collected on any goal are baseline data — the starting reference point against which all progress is measured.
Build your first QR code scan specifically for baseline collection at goal initiation, and label those rows clearly in your spreadsheet. This single practice transforms your data from a record of activity into a genuine measure of growth.
💙 A Teacher’s Story: The Wednesday That Changed Everything
Ms. Callahan had taught in a self-contained special education classroom for six years. She was good at her job. Her students made progress. But every Wednesday afternoon — progress note writing day — she felt a specific kind of dread.
“I would sit down with my paper data sheets,” she recalls, “and realise I had gaps. Whole days where I simply had not had a free hand to record data. I was filling in what I could remember. That is not data. That is a guess.”
She spent one free planning period setting up a Google Form with a QR code for each of her seven students. She printed and laminated the cards and stuck them on each student’s desk corner.
“The first week, I scanned maybe thirty percent of what I should have,” she admits. “But by week three, scanning had become automatic. I would finish a trial, reach for my phone, scan, fill in three fields, submit. Fifteen seconds. My paraprofessional started doing it too — I had not even asked her to. She just picked up the card and started scanning.”
By the end of the first month, Ms. Callahan had more data than she had collected in the previous semester. Her Google Sheets dashboard showed her, at a glance, that one student was plateauing on a reading fluency goal while significantly accelerating on a phonics goal — information that changed how she structured that student’s next two weeks.
“My next progress report took me forty-five minutes,” she says. “The report before that had taken me three hours. And it was better. I had the actual data to show parents. I had graphs. I had trend lines.”
She pauses.
“For the first time, I felt like my data was actually about my students. Not about covering myself.”
❓ FAQs About Automating IEP Data Sheets
Q: What is the fastest way to collect IEP data during class transitions?
The fastest method is a QR code linked to a pre-built Google Form. When scanned, the form opens instantly with pre-populated dropdown fields for student name, goal, and performance level. A Special Ed Teacher can scan, complete, and submit a data entry in under 30 seconds — fast enough to complete during any class transition without pausing instruction.
Q: Is Google Forms FERPA compliant for student data?
Google Workspace for Education — the version of Google tools provided to schools by their district — includes data processing agreements that meet FERPA requirements. A Special Ed Teacher should always use their school-issued Google Workspace for Education account, never a personal Gmail account, when collecting any student-identifiable data.
Q: How do I create a QR code for a Google Form?
Copy the shareable link from your Google Form using the “Send” button (link icon). Paste that link into a free QR code generator such as goqr.me or qrcode.com. Download the QR code image, print it, and laminate it. When scanned with any smartphone or tablet, it opens the form directly — no app required.
Q: Can paraprofessionals collect IEP data using this system?
Yes. The QR code + Google Form system is specifically designed so any staff member in the room — teacher, paraprofessional, or specialist — can scan a code and submit data without needing access to the teacher’s device or account. The form submits directly to the shared Google Sheets dashboard, and a “Who collected data?” field ensures proper attribution.
Q: How do I turn Google Sheets IEP data into a progress graph?
In your Google Sheets data tab, select the date column and the percentage/score column for a specific student. Go to Insert → Chart. Select a line chart type. Google Sheets automatically generates a progress graph that updates every time new data is submitted via the form. This graph can be copied into a Google Slides report for IEP meetings or progress notes.
Q: How many QR codes should a Special Ed Teacher create?
Most efficiently: one QR code per student, all linked to the same Google Form that uses a student-name dropdown. This gives you one scannable card per student, one form to maintain, and one spreadsheet to review. As an alternative, create one QR code per goal area (reading, writing, maths, behaviour) for a classroom where multiple students share goal domains — allowing even faster data entry with fewer dropdown selections.
Q: What is the difference between paper IEP data sheets and this digital system?
Paper data sheets require physical location, manual handling during busy periods, transcription from paper to digital for reporting, and manual graphing. The Google Forms + QR code system collects data digitally at the point of observation, automatically organises it into a spreadsheet, generates live progress graphs without any additional work, and can be accessed from any device by any authorised staff member. The digital system is faster to collect, more consistent in format, and significantly easier to use for progress reporting.
🔗 Trusted Resources for Special Ed Teachers
| Resource | What It Offers | Link |
|---|---|---|
| 📋 Google Forms — Official Documentation | Complete guide to building forms and linking to Sheets | support.google.com/docs/forms |
| 📊 Google Sheets — Charts and Graphs Guide | Official guide to creating progress charts | support.google.com/sheets |
| 🔲 goqr.me — Free QR Code Generator | Free, no-login QR code generation | goqr.me |
| 🎨 Canva — Free Design Tool | Design laminated QR code cards | canva.com |
| 🏛️ IDEA — Official Special Education Law | Legal framework for IEP data requirements | sites.ed.gov/idea |
| 📚 EdWeek — AI and IEP Research, 2026 | Current research on technology adoption in special education | edweek.org |
| 🧑💻 Datability (IEPData.com) | Purpose-built IEP data collection tool if scaling beyond Google | iepdata.com |
💙 Final Thoughts: Your Data Should Work as Hard as You Do
A Special Ed Teacher who is documenting from memory at 5pm is not failing. They are doing what any human does when the system is not designed to fit the reality of the job.
The reality is: data collection has to happen in the same chaotic space where teaching happens — during transitions, between activities, in the twenty seconds between one student’s need and the next. Paper data sheets were never designed for that reality.
A QR code on a laminated card, linked to a 30-second Google Form, collected into a live spreadsheet that generates progress graphs without any additional work — this is a system that was designed for that reality.
Build it once. One planning period. Then watch your data collection go from the thing you dread most to the thing that runs quietly in the background while you do the work you actually love.
Your students deserve data that truly reflects their progress. And you deserve a system that makes that possible without consuming every hour you have. 💛
📝 This article is for informational and educational purposes only. Always use school-issued Google Workspace for Education accounts (not personal Gmail) for any student data collection. Consult your district’s technology and privacy policies before implementing any digital data collection system. FERPA compliance is the responsibility of the school and district, not Google.


