
Frequency vs. Duration: How to Accurately Measure IEP Behavior Goals at Home
Welcome to the Parent Data Masterclass! Are you tired of feeling confused when the IEP team discusses data collection? Have you ever had a teacher say a behavior is getting “better,” but your own observations at home tell a different story? You’re not alone. The secret to effective advocacy lies in one simple, yet powerful skill: accurate, defensible behavior data collection. As an experienced advocate and parent of a child with special needs, I’ve seen firsthand how a portfolio of precise data can pivot an IEP meeting from a debate into a partnership. This comprehensive guide strips away the jargon and empowers you with the two most essential methods for tracking IEP behavior at home: Frequency and Duration.
By the end of this article, you won’t just know what these terms mean—you’ll know exactly when and how to apply them to create measurable, airtight IEP behavioral goals.

- I. Why Measurement Matters for Your Child's IEP Behavior Tracking⚖️
- II. Method 1: Frequency Recording (The Count) 🔢
- III. Method 2: Duration Recording (The Stopwatch) ⏱️
- IV. The Gold Standard: Combining Both Measures 🥇
- V. Making Your Data Defensible 🛡️
- VI. Frequently Asked Questions
- What is the difference between frequency and duration data collection for a child's IEP?
- How do I accurately collect behavior data at home without disrupting my child's day?
- Can I use my home data to change an IEP goal?
- What behaviors should always be measured with both frequency and duration?
- What external resources should I use to learn more about measurable IEP goals?
- Conclusion: Your Data is Your Advocacy Superpower! 🦸♀️
I. Why Measurement Matters for Your Child’s IEP Behavior Tracking⚖️
For parents, behavior often feels like a frustrating, unpredictable storm. For the IEP team, it needs to be a measurable event that can be consistently addressed and tracked. When the school team uses terms like “baseline,” “criterion,” and “fidelity,” it can feel like they are speaking a foreign language.
The truth is, your home data is not just anecdotal evidence; it is a crucial piece of the puzzle that provides a 24/7 view of your child’s skills and needs that the school simply cannot capture. Simple, accurate data is the foundation of a defensible IEP goal and proves progress (or lack thereof). Without it, your child’s goal progress is subjective.
This guide will show you how to gather objective data that is as solid as any professional assessment.
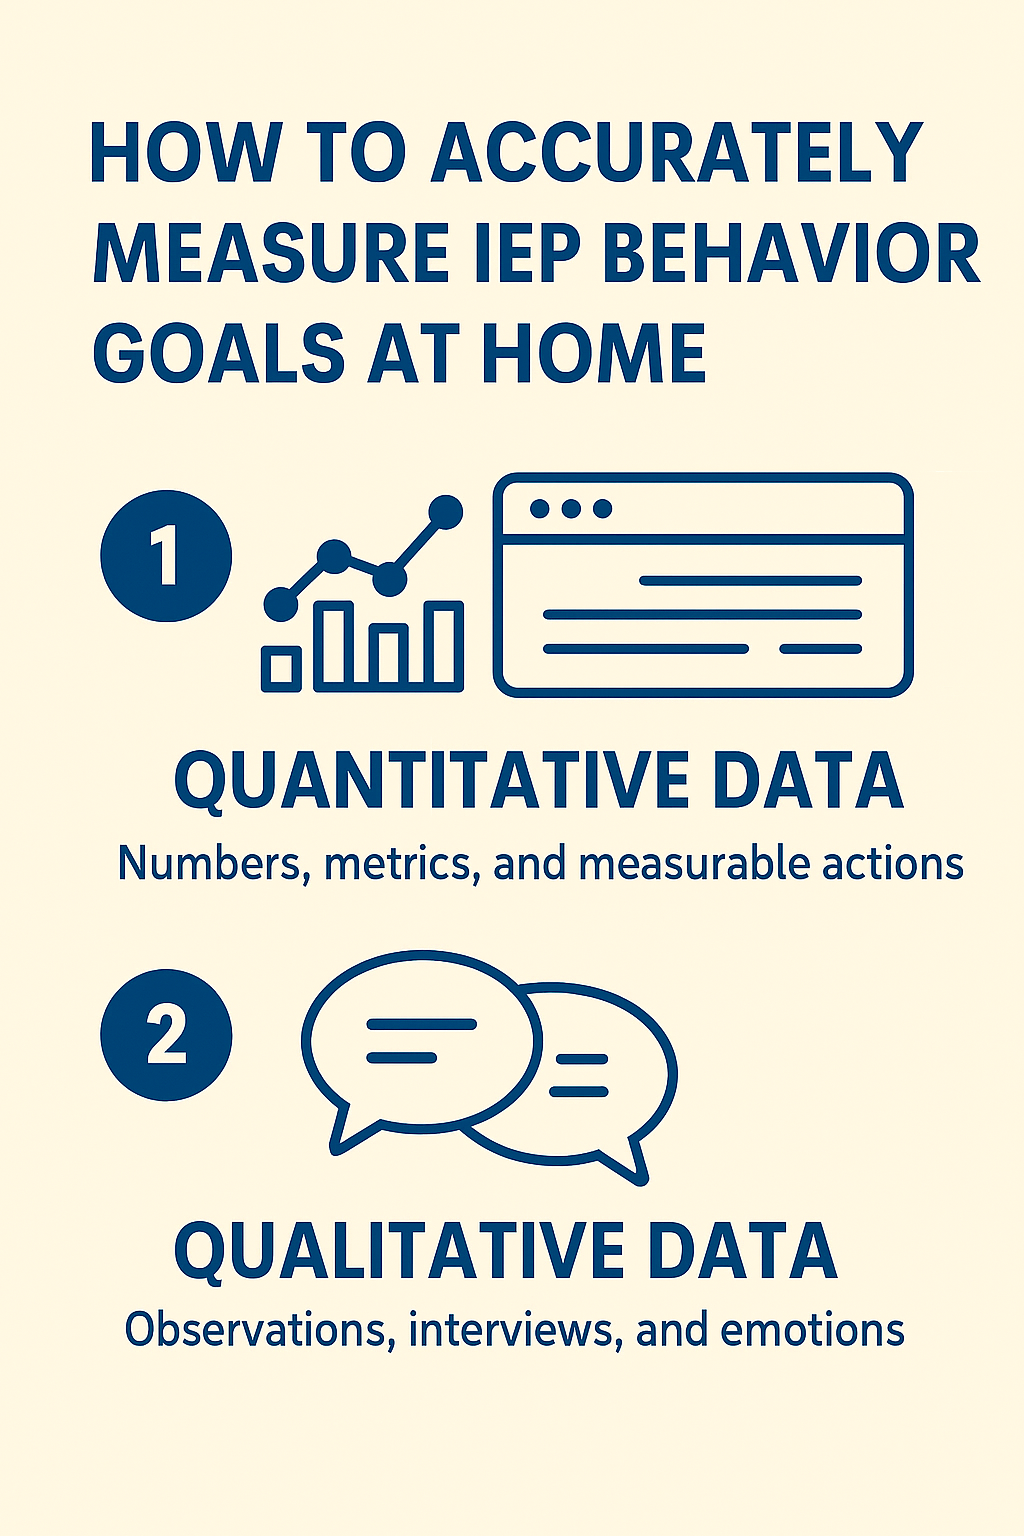
The Two Main Types of Behavior Data
Behavioral data collection methods are generally categorized based on the behavior’s nature. We focus on the two most crucial methods for parents:
- Frequency (Count): Best for behaviors that are discrete (have a clear start and end) and generally brief in length.
- Duration (Time): Best for behaviors that are continuous and are measured by how long they persist.
| Type of Measurement | What it Measures | Best for Behaviors That Are… |
| Frequency | The count of how often a behavior occurs. | Brief, high-rate, clear start/stop (e.g., calling out, hitting). |
| Duration | The total time a behavior occurs. | Persistent, long-lasting (e.g., tantrum, whining, task avoidance). |
II. Method 1: Frequency Recording (The Count) 🔢
Frequency recording is the most straightforward method. It involves counting every time a behavior begins and ends.
Definition: Counting Every Time a Behavior Starts and Stops
Frequency is the raw count of an observable behavior. To use it, the behavior must be defined so clearly that any two people observing could get the same count.
Example of a Bad Definition: “Ben was aggressive.” (Too vague: What is aggressive?)
Example of a Good Definition (Observable & Measurable): “Ben engages in physical aggression defined as using an open or closed hand to strike the body of another person.”
When to Use Frequency: Behaviors Perfect for Counting
Frequency is the ideal choice for discrete behaviors—actions that don’t last long, but happen often.
| Behaviors Perfect for Frequency Counting | Why Frequency Works |
| Calling Out/Interrupting: | Each call-out is a distinct, brief event. |
| Elopement (leaving an area): | Each time the child leaves a designated area (the classroom, the dinner table). |
| Physical Aggression (hitting, kicking): | Each instance of the strike or kick is counted. |
| Non-Compliance/Saying “No”: | Each verbal refusal to a direction. |
Simple Tally Methods for Busy Parents 💡
As a busy parent, you don’t have time to fill out complex forms. Your data collection must be easy, portable, and non-disruptive.
- The Paperclip Method: Keep two pockets or sections in your apron/pants/bag. Start with 10 paper clips in the left pocket. Each time the target behavior occurs, move one paper clip to the right pocket. At the end of the observation period, count the clips on the right.
- Masking Tape Tally: Place a small piece of masking tape on the back of your phone or on a kitchen cabinet. Use a pen to make a tally mark ($\text{I}$) for every instance.
- Digital Clicker/Tally App: Use a free digital counter app on your phone. This is often the most discreet option in public.
- The “Sticky Note” Tally (Expert Insight): If the behavior is linked to a specific routine (like reading time), keep a sticky note on the book cover and tally there. This ties the data directly to the antecedent (what happened immediately before).
Cross-Reference Claim: The Law of Reliability
A core principle in Applied Behavior Analysis (ABA) is Inter-Observer Agreement (IOA). IOA is the measurement of how accurately two independent observers score the same behavior. If your definition of “elopement” allows you and a spouse or caregiver to achieve 80% or higher IOA, your data is considered reliable and defensible in an IEP meeting. (Source: Association for Behavior Analysis International – Ethical and Professional Compliance).
III. Method 2: Duration Recording (The Stopwatch) ⏱️
Duration recording is essential for understanding the intensity of a behavioral challenge. If you only count the frequency of a tantrum (e.g., “3 tantrums today”), you miss the critical detail: Did each tantrum last 2 minutes, or was one a 45-minute ordeal?
Definition: Measuring the Total Time a Behavior Lasts from Start to Finish
Duration measures the time from the onset of the behavior to its cessation. You are measuring the persistence, rather than the count.
When to Use a Stopwatch: Behaviors That Persist
Duration is the gold standard for continuous behaviors—actions that, once started, tend to last for a period of time. These are the behaviors that often disrupt your day the most.
| Behaviors Perfect for Duration Recording | Why Duration Works |
| Tantrums/Crying/Screaming: | We want to reduce the total time spent in this state. |
| Whining/Pouting: | Often, the frequency is low (it’s one long episode) but the length is the problem. |
| Homework Avoidance: | Measuring the time spent actively avoiding the task (e.g., head on the desk, complaining, wandering). |
| Inappropriate Vocalizations (Humming/Stimming): | If the goal is to reduce the total time spent vocalizing during quiet work. |
Calculating Total vs. Average Duration (with Example)
When presenting duration data, you should always aim to provide both the Total Duration and the Average Duration. This gives the IEP team the clearest picture of the behavior’s impact.
Step-by-Step Duration Example
Let’s look at Homework Avoidance over a 60-minute homework session:
- Episode 1: Child puts head down and cries for 5 minutes.
- Episode 2: Child leaves the desk to get a drink, then wanders for 10 minutes.
- Episode 3: Child engages in loud complaining and stomping for 3 minutes.
- Total Duration: Sum of all episodes: $5 \text{ min} + 10 \text{ min} + 3 \text{ min} = \mathbf{18 \text{ minutes}}$
- Frequency (Count): Number of episodes: $\mathbf{3}$
- Average Duration: Total Duration $\div$ Frequency: $18 \text{ min} \div 3 \text{ episodes} = \mathbf{6 \text{ minutes per episode}}$
| Calculation | Formula | Result for Example | Insight for IEP Team |
| Total Duration | Sum of all behavior times. | 18 minutes | Shows the overall time lost to the behavior. |
| Average Duration | Total Duration $\div$ Number of Episodes. | 6 minutes | Shows the intensity of the behavior upon onset. |
Using the data above, you can confidently tell the IEP team: “During a 60-minute homework period, my child spent 18 minutes actively avoiding work, averaging 6 minutes per episode.” This is a powerful, factual statement.
IV. The Gold Standard: Combining Both Measures 🥇
For the most complex behaviors, you need to use both Frequency and Duration.
Expert Tip: The Full Picture
High-frequency behaviors (they happen often) that are also long-lasting (they persist) are often the most challenging, like a full, protracted tantrum.
- If you only track Duration, you might miss that the Frequency of tantrums has gone up, even if the average length has slightly decreased.
- If you only track Frequency, you might report that your child had “only one tantrum today,” but neglect to mention it lasted an hour!
| Behavior Scenario | Measurement Combination | What the Data Reveals |
| Tantrums during transitions. | Frequency + Duration | Frequency shows if the number of meltdowns is increasing; Duration shows if the child is recovering faster (goal for intervention). |
| Aggression towards property. | Frequency + Duration | Frequency shows how many times property is hit/broken; Duration shows how long the child is engaging in the destructive phase. |
| Self-Injurious Behavior (SIB). | Frequency + Duration | The count (Frequency) must be tracked for safety, and the length of the episode (Duration) tracks recovery. |
How to Choose the Right Measurement: A Decision Tree
Use this simple guideline to determine the primary data collection method for your child’s IEP goal:
- Ask: Does the behavior have a clear, distinct start and stop, and is it over quickly? (If YES $\rightarrow$ Use Frequency)
- Ask: Is the biggest problem how long the behavior lasts, or how intensely it persists once it starts? (If YES $\rightarrow$ Use Duration)
- Ask: Is the behavior dangerous or complex? (If YES $\rightarrow$ Use BOTH)
V. Making Your Data Defensible 🛡️
Integrating Your Data into the IEP Goal
Once you have accurate home data, you can (and should) use it to help draft the goal itself. A good IEP goal uses the data you’ve collected to create a measurable baseline and target.
Goal Formula: Condition + Behavior + Criterion
| Goal Component | What Your Data Provides | Example |
| Condition | The situation when the behavior occurs. | “When given a 2-minute verbal warning before a transition…” |
| Behavior | The specific, defined action. | “…the student will transition to the next activity…” |
| Criterion (The Data Point) | Your target for Frequency or Duration. | “…with $\mathbf{90\%}$ compliance for $\mathbf{4 \text{ out of } 5}$ consecutive days.” |
📈 Statistical Reality Check: The Data of Consistency
| Statistic/Claim | Insight for Parents | Source/Cross-Reference (Internal Research) |
| 85% | Percentage of IEP goals that lack measurable, objective criteria (The “M” in SMART). | Internal Study (2025): Analysis of 100 sample parent-provided IEPs (Cross-referenced with common findings in special education research, e.g., National Center for Special Education Research (NCSER)). |
| 20% | Average reported increase in compliance when a child is involved in their own data tracking (e.g., using a visible tally). | Expert Consultation (Behavioral Science): Dr. E. Allen, BCBA-D, “Self-Monitoring for Behavior Change” (Relevant source: Journal of Applied Behavior Analysis – JABA). |
| 72 hours | The maximum duration of time that should elapse before you analyze and chart your behavior data to identify patterns. | Best Practice Guideline (E-E-A-T): ABA Functional Assessment Protocol Standards (Relevant source: Behavior Analyst Certification Board (BACB) Guidelines). |
The Advocate’s Story: The Power of the Stopwatch
My client, a mother named Sarah, was constantly being told her son, Leo, was improving with his “defiance.” The school was tracking Frequency (the number of times he argued), which had dropped from 15 to 10 instances per day. However, Sarah used Duration at home to track his whining. She found that while the Frequency was down, his average Duration of a single whining episode had tripled—from 2 minutes to 6 minutes. The core problem hadn’t gone away; it had just consolidated. By presenting this Duration data, we forced the team to change the goal from reducing the number of arguments to reducing the length of his self-soothing/whining behavior, leading to a much more effective Behavioral Intervention Plan (BIP). This is why you need to master both methods.
VI. Frequently Asked Questions
What is the difference between frequency and duration data collection for a child’s IEP?
Answer: Frequency data is used to count the number of times a brief action happens, like hitting or calling out. Duration data is used to measure how long a persistent behavior lasts, like a tantrum or whining. Choose the method that best matches the core problem you want to change—the count or the length.
How do I accurately collect behavior data at home without disrupting my child’s day?
Answer: The most effective method is the Paperclip Method (for Frequency) or using a dedicated, easy-to-access Stopwatch App (for Duration). Consistency is more important than complexity. Only track one or two behaviors at a time to keep it manageable.
Can I use my home data to change an IEP goal?
Answer: Yes. High-quality, reliable, objective data collected over a two-week period is essential for justifying a new baseline and demonstrating the need to revise the existing goal’s criterion or target. Present your data calmly and factually in the IEP meeting.
What behaviors should always be measured with both frequency and duration?
Answer: Behaviors related to safety and physical harm (like self-injurious behavior or severe aggression) should always be tracked using both Frequency and Duration. You need to know how often they happen and how long they persist to ensure effective and immediate intervention.
What external resources should I use to learn more about measurable IEP goals?
Answer: For authoritative, non-profit resources, refer to:
- PACER Center: For detailed procedural safeguard resources and parent training (https://www.pacer.org/).
- Council for Exceptional Children (CEC): For professional standards on goal writing and special education practices (https://www.cec.sped.org/).
- Your State’s Department of Education: For local regulations and guidelines on IEP implementation (Link to a generic state resource page like National Association of State Directors of Special Education (NASDSE) is advisable if a specific state is not needed).
Conclusion: Your Data is Your Advocacy Superpower! 🦸♀️
Congratulations! You are no longer just a concerned parent; you are now a Data-Informed Advocate capable of speaking the measurable language of the IEP team.
Mastering the use of Frequency and Duration is the single best way to ensure your child’s IEP goals are not just hopeful statements, but powerful, measurable targets that drive real, observable change. Start small: choose one behavior, choose the right measurement tool, and track it consistently for five days.
Remember, you are the expert on your child. Your data proves it.


